If you have ever worked with numerical methods you will know that a major issue with using these methods is not only the exactness of the method but most time, we struggle too with stability of each of the methods.
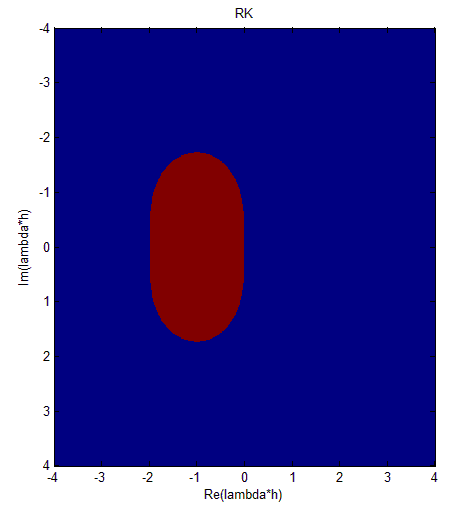
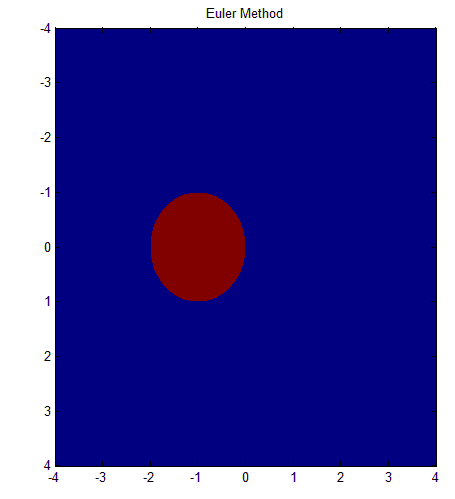
In this post I am simply going to give a Matlab code which you can copy and paste into your Matlab, simulate and get a plot representing the stable and the unstable region of these two numerical methods:
- Euler Method
- Runge Kutta method
Learn more about the A stability.
Matlab code
clear all
x=-4:0.01:4;
y=-4:0.01:4;
f1=@(x,y) sqrt((1+x)^2+(y)^2);
f2=@(x,y) sqrt((1+x+0.5*(x^2-y^2))^2+(y+x*y)^2);
subplot(1,2,1)
title('Euler Method')
subplot(1,2,2)
title('RK-method')
for i=1:2
if i==1
fun=f1;
else if i==2
fun=f2;
end
end
for m=1:length(x)
for n=1:length(y)
if fun(x(m),y(n))<1
z(n,m)=1;
else
z(n,m)=0;
end
end
end

subplot(1,2,i)
imagesc(x,y,z);%stability region
if i==1
title('Euler Method');
else if i==2
title('RK');
xlabel('Re(lambda*h)');
ylabel('Im(lambda*h)');
end
end
end
Figures
Euler method
Runge Kutta method

The Blue area represents the unstable region and the red area represents the stable region.


