As you may all know, there are a ton of ways of entering data or importing it into AutoCAD. This can be done through automated scripts written in your favorite language or simply developed in LISP. It can also be done through the use of Autodesk’s extensions and packages such as Civil 3D or Autodesk Map 3D. Another way to do this is to have an XML or excel file and to import that file into tables developed AutoCAD’s built-in table database module.
All in all, it’s no surprise that you need to enter data into AutoCAD from a third-party or external source. And there is no surprise in the fact that Autodesk has already addressed these challenges. To illustrate the ways in which you can enter data, we’re going to use a real-life scenario as opposed to just a few pointers in the traditional tutorial style. We’re going to enter survey statistics and data into AutoCAD, the way engineers and architects, just to name a few, a required to do all the time. Read on.
First Things First
Understanding AutoCAD’s nature and the way it refers to its elements, or should we say, the way it draws its elements is essential to understanding the rest of the tutorial. While we humans can visually infer a straight or curved line as it is, AutoCAD and every other computer system will be using points and coordinates, extended with processing functions and procedures to read and ‘infer’ what these elements are, a prerequisite to displaying them on the canvas. How this working actually affects the entering of data will be made clear with each sub-topic but a general rule of thumb is to remember your AutoCAD training when doing this.

For the guide, we’re going to focus on entering data that represents elements as opposed to point cloud data or data otherwise that would be useful in such a context but not always available in real life scenarios.
Line Segments
Each line segment is going to be comprised of a coordinate map. For us humans, this is a degree of incline and the distance from the point of origin. So if you want to draw a horizontal line, the bend is going to be 90˚ (anti)clockwise from the point of origin and will extend as far as the distance stated. The incline and length of the line segment can be written in the following syntax:
“@” + length + “<” + Northing/Easting coordinates
An example of the above expression is:
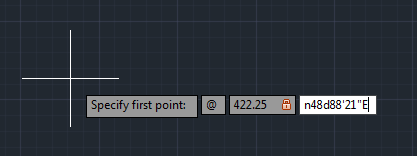
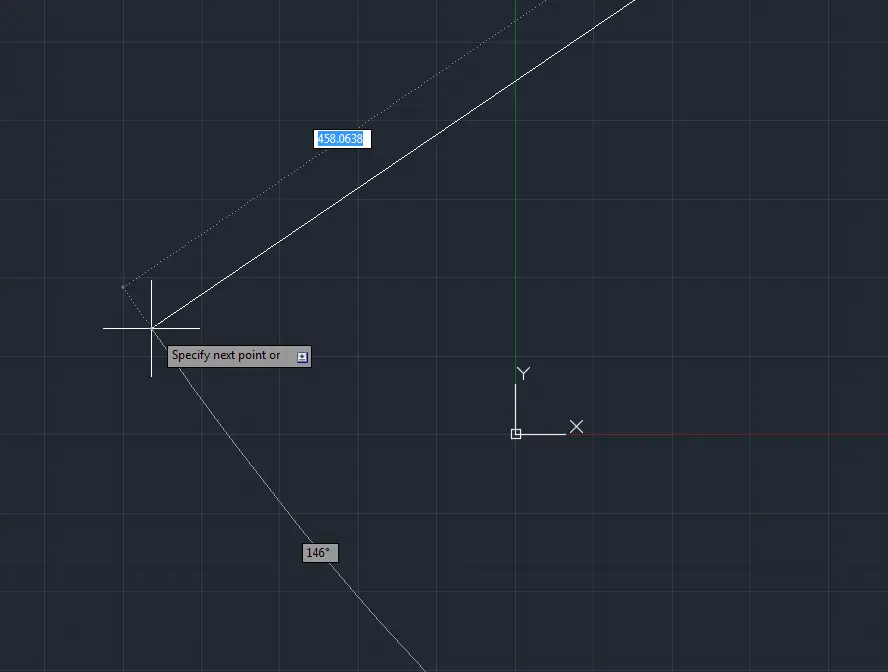
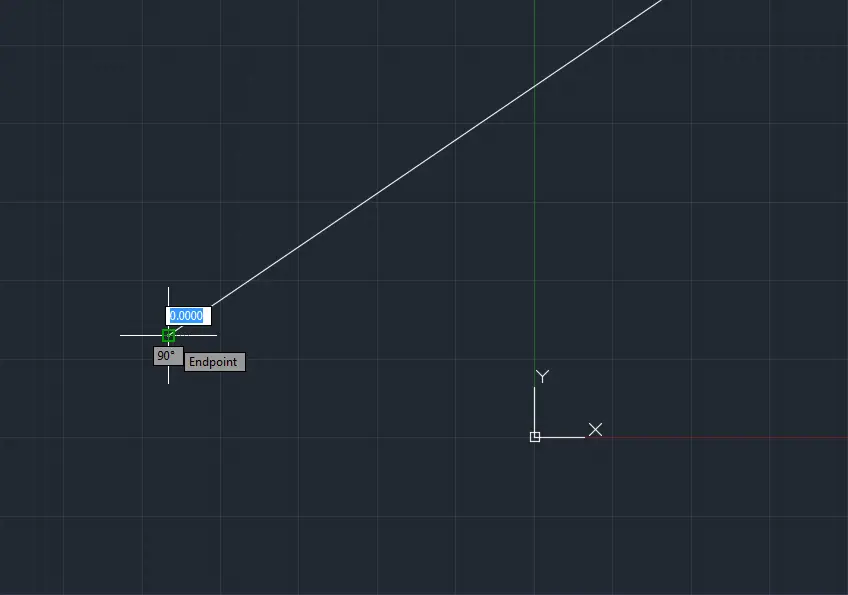
@422.25<N48D88’21″E
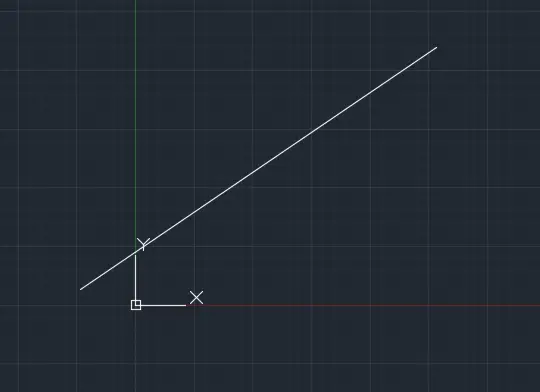
To enter this information and draw a line segment that follows this, use the LINE command. Commands are meant to automate the process that you can manually commit and offer the ability to calibrate all your elements according to a set criteria as opposed to moving your pointer with slight changes to achieve the right specifications. Following the LINE command, entering the coordinates as described above will enter a line of the stated specification. Take a look at the series of screenshots that shows the same:
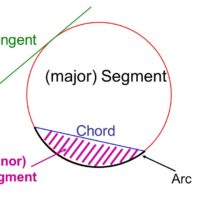
Curves
Since curves curve (no pun intended), you need to keep in mind the orientation of the curve. This is not required with line segments and allows you to rotate the line from its origin, or another defined origin when need be. Check out the following guidelines for building curves.
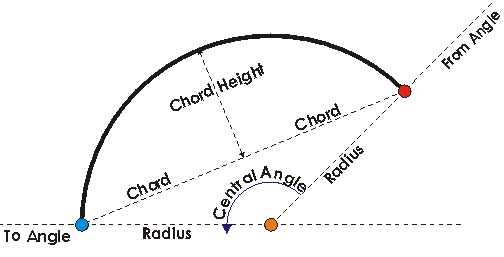
The following images will help in understanding what an arc is and how to think when drawing arcs and curves, not just in AutoCAD but in any CAD or drawing package.
Non-tangent Curves
When starting your drawings with a curved element or when your curved element is not an extension of the previously drawn element, you can use a radial bearing technique or you can use chord distances and bearing combinations, since a curve is essentially a line segment with a bend.
Using the Line command, you can draw a line as stated before and use the ends of that line to create an arc. Create a line from which you will create a curve. Once you have created the line, initiate the ARC command. The starting of the line will serve as your starting point for the curve, and the ending point or any other of your choice as the end of the curve. Following this, you will be asked to enter the radius. Upon entering the radius, you will have an arc driven from a straight line according to your specifications.
Check this out here:
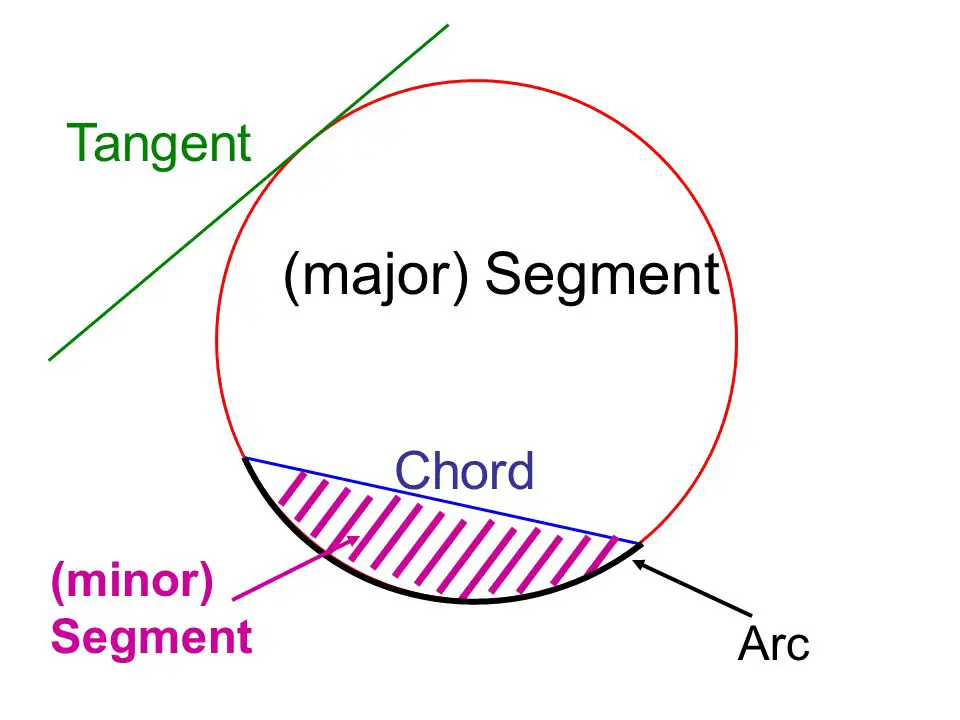
Tangent Curves
Tangent curves can be trickier or easier to work with depending on your definition. Tangent curves have the added facilitation of an originating point. That means, you can draw the curve from the last element hence, making the process a little shorter. But the way to create a tangent curve does add a few steps where it takes one out. For example, after drawing the element from which the curve must extend, you draw a line segment originating from the tangent’s origin. This line needs to be parallel to the previously drawn element.
Once the element is draw, the starting point of this line segment, needs to be rotated along the ending point so that the ending point stays at its place. This rotation basically just outlined your curve that you want to build. Now, we use the end point of the line segment as the start of the arc, and the start of the line segment as the center of the arc. In this way, the curve is literally the same as the curve along which you rotated the line segment to begin with. Voila, now you have an arc.
Note: In the case you want to close off the whole drawing, enclosing the curve with the initially drawn line segment, all you have to do is connect the center of the arc to the start of the line and you’ll have created a boundary out of your curve and line combo.
Conclusion
Entering survey data, is all about creating lines, at least for the most part. This article was meant to show how this can be achieved with the LINE / ARC command since these are the basics of all extended functionality. If you’re looking to use extensive amounts of data, such as an excel sheet or XML/JSON dataset, you need to use an import parameter or one of the parsers available, respectively.
For line segments and other drawing elements, the syntax will essentially stay the same. In the case, you have your data in other formats, Microsoft Excel and other packages almost always give you formulas and commands to restructure your data automatically over a given range. Concatenate and rearrange your data the way you want, and you’ll be good to go.